General Overview and Background
What is genomic imprinting?
Genomic imprinting occurs when a gene is expressed in a parent-of-origin specific manner. Sexually reproducing diploid species inherit two copies of every genetic locus: one from their mother and one from their father. Most genes are expressed equally from these two copies. However, maternally expressed imprinted genes (MEGs) are expressed preferentially from the maternally-inherited allele, whereas paternally expressed imprinted genes (PEGs) are expressed preferentially from the paternally-inherited allele. Imprinting is an epigenetic phenomenon: parent-of-origin-specific expression occurs at imprinted genes even if the maternally- and paternally-inherited copies are genetically identical.
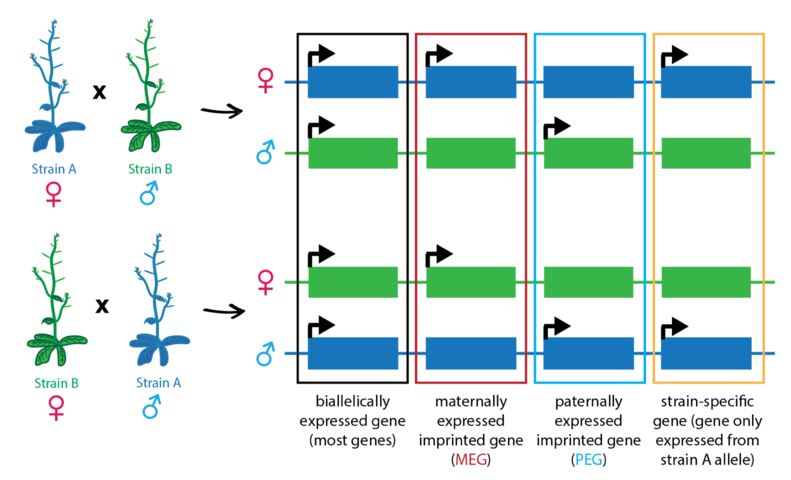
Above: Example gene expression patterns for biallelically-expressed genes, maternally- and paternally-expressed imprinted genes, and a strain-biased gene. For strain-biased genes, one strain's allele is more highly expressed than the other's, regardless of parent-of-origin.
In flowering plants, imprinting occurs primarily in the endosperm, a seed tissue that mediates nutrient transfer between the maternal parent and the embryo or germinating seedling. This nutrient-rich tissue is also particularly important to humans, as the endosperm is the primary source of calories from cereal crops like rice, corn, and wheat. Understanding how genomic imprinting influences endosperm development is an important area of active research. Like the embryo, the endosperm is the product of fertilization. Flowering plants reproduce by double fertilization. Pollen grains carry two haploid sperm. One sperm fertilizes the haploid egg cell in the female gametophyte to produce the diploid embryo. The second sperm fertilizes the diploid central cell to produce the endosperm. In most flowering plants the central cell is diploid (due to the fusion of two genetically identical haploid nuclei) and thus the endosperm is triploid, with 2 maternal genomes and 1 paternal genome. Thus, in the absence of genomic imprinting, genes in the endosperm are expressed to be expressed in a 2♀:1♂ ratio.
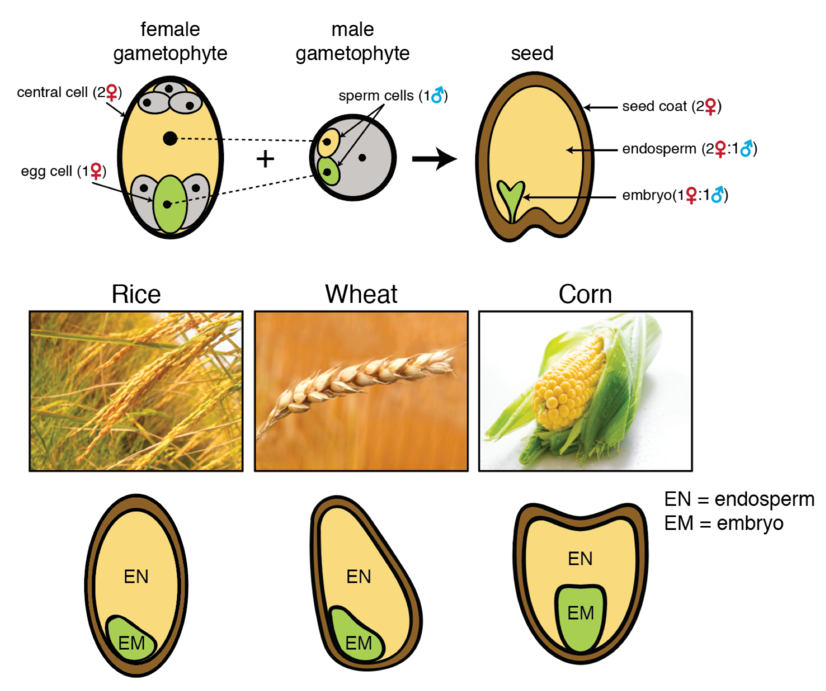
Above: Illustration of double-fertilization of the egg and central cells by the two sperm cells in the pollen grain. This produces the diploid embryo (1♀:1♂) and triploid endosperm (2♀:1♂), surrounded by maternal integuments (the seed coat). Endosperm is found in the mature grains of many plants, including cereal crops like rice, wheat, and corn, and is a primary source of calories consumed by humans.
For more information on genomic imprinting, see:
Gehring M, Satyaki PR. Endosperm and imprinting, inextricably linked. Plant Physiology 2017; doi: https://doi.org/10.1104/pp.16.01353.
Patten MM, Ross L, Curley JP, Queller DC, Bonduriansky R, Wolf JB. The evolution of genomic imprinting: theories, predictions and empirical tests. Heredity 2014; 113(2):119-128. doi: https://dx.doi.org/10.1038%2Fhdy.2014.29.
Rodrigues JA and Zilberman D. Evolution and function of genomic imprinting in plants. Genes & Dev 2015; 29:2517-2531. link: http://genesdev.cshlp.org/content/29/24/2517.
Satyaki PRV, Gehring M. DNA methylation and imprinting in plants: machinery and mechanisms. Crit. Rev. Biochem. Mol. Biol. 2017; 52:163-175. doi: https://doi.org/10.1080/10409238.2017.1279119.
How are imprinted genes identified?
High-throughput sequencing techniques like RNA-seq are commonly used to assess imprinting genome-wide. In this approach, RNA-seq is performed on seeds from reciprocal crosses between two strains or species that have diverged enough that alleles can be distinguished. Single nucleotide polymorphisms (SNPs) or small indels that differ between the two strains are used to infer whether a sequencing read was produced from the maternally-inherited (matrigenic) or paternally-inherited (patrigenic) allele. The number of maternally- and paternally-derived sequencing reads are counted, and various statistical tests and cutoffs are applied to determine whether these counts are likely to derive from a biallelically-expressed gene or an imprinted gene. For most studies, imprinted genes are defined as having significantly biased expression from one parental allele, rather than exhibiting completely monoallelic expression. Information from reciprocal crosses is required to distinguish imprinted genes from strain-biased genes (genes where one strain's allele is more highly expressed than the other strain's, regardless of parent-of-origin).
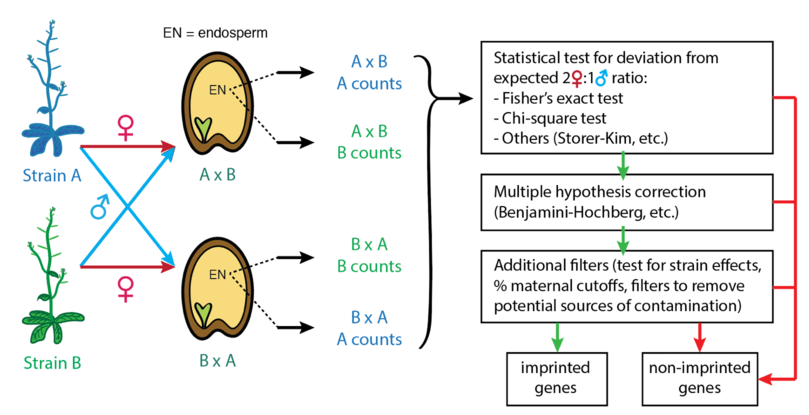
Above: Typical workflow used to assess imprinting genome-wide using RNA-seq, starting from allelic counts derived from RNA-seq of reciprocal hybrid seeds or endosperms. Note that conventionally the maternal parent is indicated first in the cross (e.g. in the cross AxB, A is the female parent and B is the male parent).
What are the goals of this database?
With the advent of techniques like RNA-seq, genome-wide imprinting datasets have been published for a number of plant species, with more studies published every year. This database aims to consolidate the data from these studies into a single repository, to facilitate analyses across studies or species and to provide a central source for obtaining these data. We have not reanalyzed any data, but present the imprinting status of genes as determined by the authors. Raw count data is provided when available. This allows users to more easily assess the parental bias of genes and depth of data available across different studies.
Using the database:
What types of information are stored in the database?
The data stored in the database can be divided into four broad categories: gene information (unique identifier, common name), conditions under which imprinting was assessed (study name, strains used, tissue, stage, and replicate), allelic count information (raw counts, total counts, and % maternally-derived reads), and imprinting information (scores and p-values obtained from tests for imprinting or strain bias as determined by that authors of the studies; overall and replicate imprinting status). Each row in the database contains allelic counts and imprinting information for a specific gene under a specific set of conditions. Some fields may be blank if a study either did not use a particular approach (e.g. did not test for strain effects) or did not provide the information. The female parent is indicated first in cross (e.g. in AxB, A is the female parent).
Gene Information
| Gene ID | The gene's unique identifier (e.g. AT4G19020 or Carubv10003999m.g) |
|---|---|
| Gene Name(s) | The (short form) name of the gene, if it exists (e.g. MET1 or CMT3) - only available for A. thaliana |
Conditions under which imprinting was assessed (metadata)
| Study | First author name and date of study that generated the data (for a link to the study itself, see the main page) |
|---|---|
| Parent A | Species, accession, and genotype (if applicable) of one of the two parents used to generate reciprocal crosses |
| Parent B | Species, accession, and genotype (if applicable) of the second parent used to generate reciprocal crosses |
| Replicate Comparison | Replicates being compared, if replicates of AxB or BxA were generated, in the form (AxB replicate) vs (BxA replicate) |
| Tissue | Tissue assayed for imprinting (e.g. embryo, endosperm) |
| Stage | Age or developmental stage of tissues assayed for imprinting |
Count data
| AxB, A counts | Number of reads from strain A detected at gene, in AxB cross |
|---|---|
| AxB, B counts | Number of reads from strain B detected at gene, in AxB cross |
| BxA, A counts | Number of reads from strain A detected at gene, in BxA cross |
| BxA, B counts | Number of reads from strain B detected at gene, in BxA cross |
| Tot. Counts, AxB | Total allelic counts in AxB |
| Tot. Counts, BxA | Total allelic counts in BxA |
| % maternal, AxB | Percent of allelic reads from the maternal allele in AxB |
| % maternal, BxA | Percent of allelic reads from the maternal allele in BxA |
Imprinting Information
| Overall Imprinting Status | Imprinting status, accounting for all replicates, as determined by the study authors - either MEG, PEG, maternally/paternally biased, not imprinted or no data |
|---|---|
| Replicate Imprinting Status | Imprinting status, as determined by the study authors, using data from this replicate only |
| Imprinting Score | Test statistic or score used to evaluate imprinting (varies by study, not used in all studies) |
| Imprinting p-value | P-value used to determine imprinting (statistical test used varies by study) |
| Strain Score | Test statistic or score used to evaluate strain bias (varies by study, not used in all studies) |
| Strain p-value | P-value used to determine strain bias (statistical test used varies by study, not used in all studies) |
Other Information
Genome Assembly: The genome assembly used to map the RNA-seq data (e.g. TAIR9, TAIR10)
Notes: Any additional information not included above that might be informative. For example, some studies validated one or more of their putative MEGs and PEGs using an independent method like Sanger sequencing - the outcome of this validation can be provided here.
Brief Tour of the Database
The main page (https://plantimprinting.wi.mit.edu) has a set of search fields at the top (see How do I use the database search function? section), followed by a list of all studies currently in the database. Studies are listed by species and sorted by date, with the most recent studies listed first. Each entry includes links to the study itself via pubmed ID and DOI, as well as a brief description. The "view all data" link below each study lists all entries in the database from that study. Since some datasets are large, displaying all entries may take a few seconds. Search results can be downloaded in CSV format (also see Can I download data from the database? ).
Clicking on one of the "view all data" links, or performing a search via the search fields, loads the search results page:
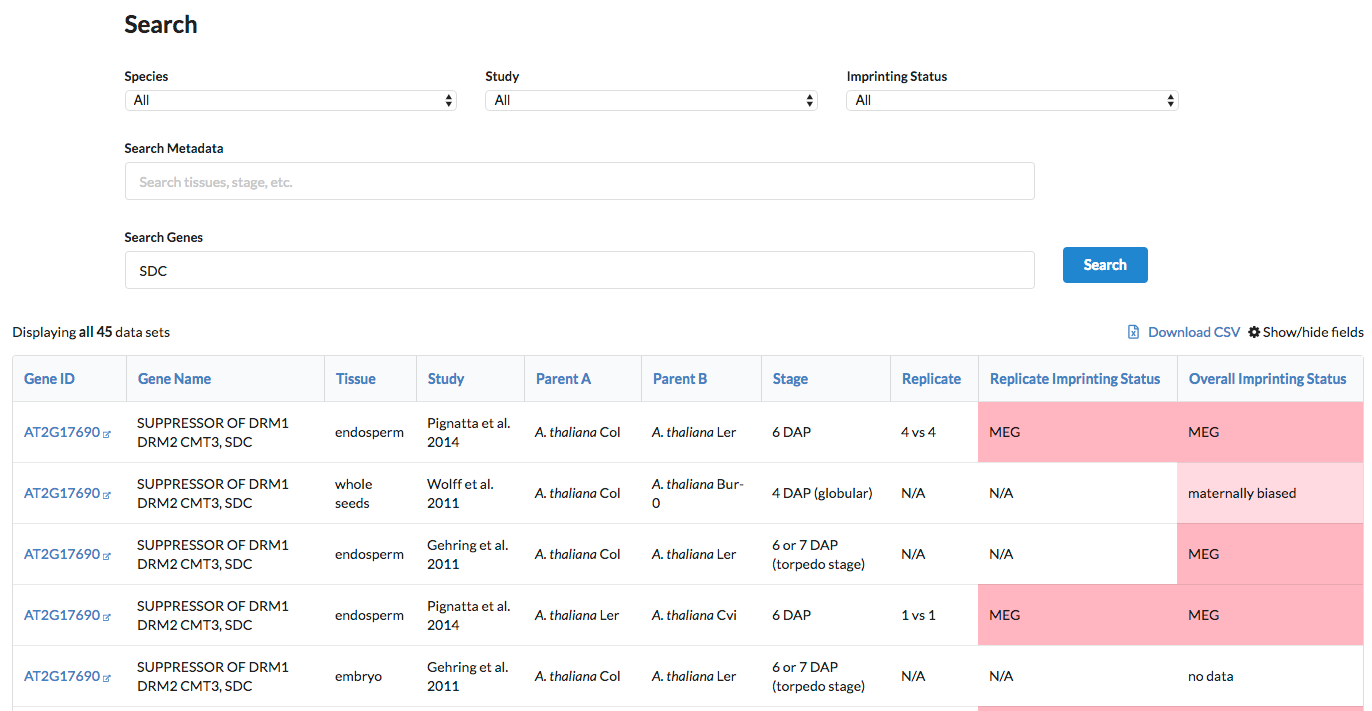
By default, only a few columns - outlining the conditions under which imprinting was assessed and the overall imprinting status of the gene - are displayed. Each gene ID, shown in the first column, links to Araport, where more detailed information can be found about the gene.
Mouse over a field's header to display a brief description of the information in that column (also see What type of information is stored in the database? ).
Other columns containing additional information, such as allelic counts, are hidden by default. Add them to the displayed results using the "Show/hide fields" button to the right of the page, above the table.
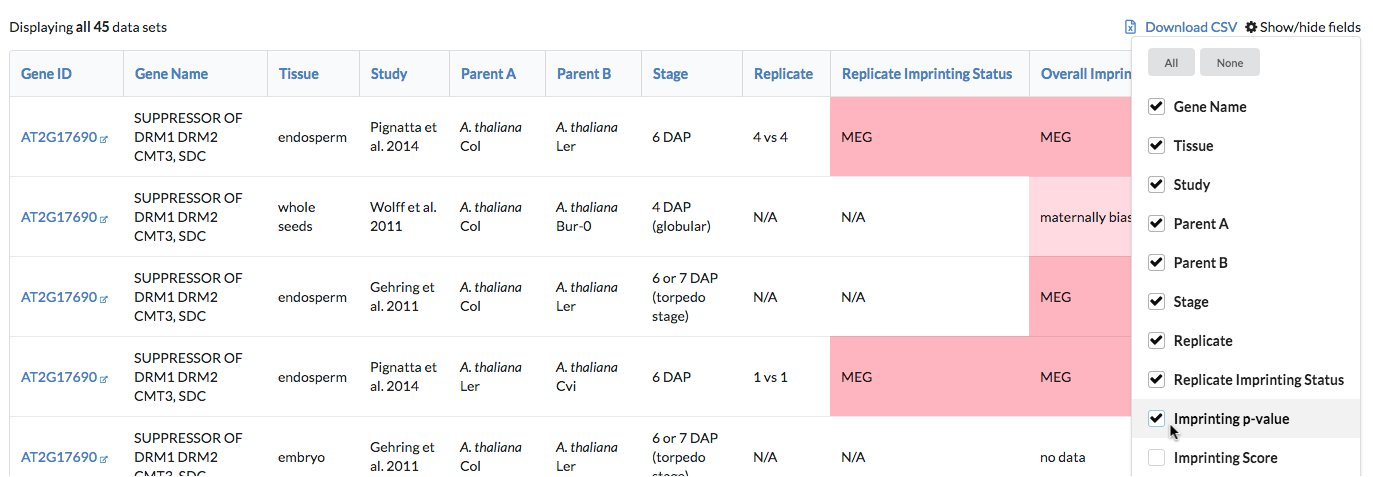
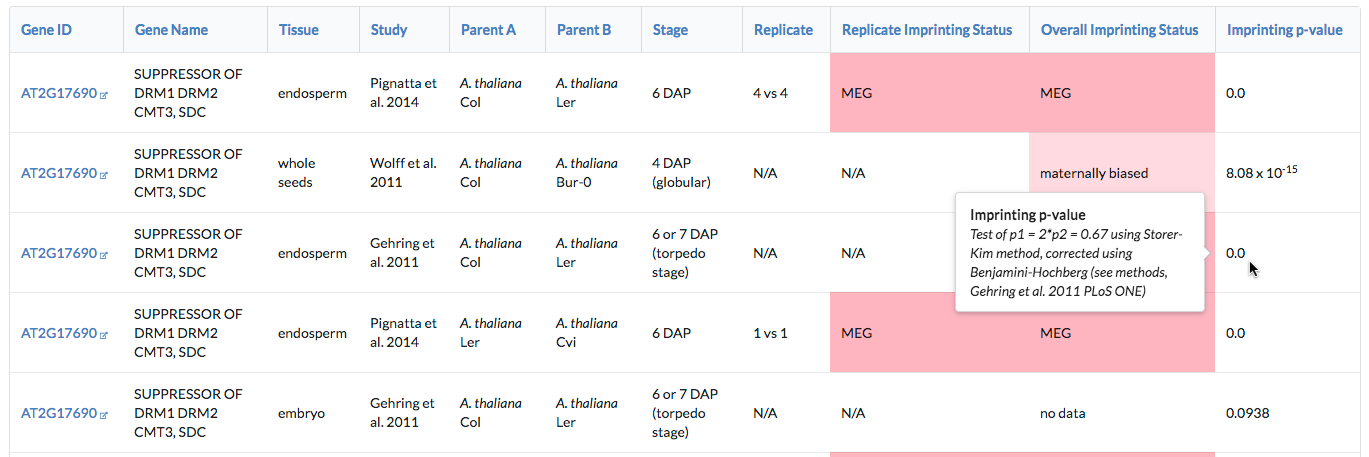
For some fields, particularly the imprinting information fields (score and p-value used to assess imprinting and strain effects), values may vary in meaning between studies. For example, one study may have used a Chi-square test to evaluate imprinting while another used Fisher's exact test, and so reported p-values will not be based on the same test. These values are included in the database under the same column, but mouseover text has been added over each entry to provide additional information about the value.
Click on any column header to sort rows in descending order (please be patient, sorts on a large number of rows may be slow; sorts on Study, Parent A, and Parent B may be particularly slow). Click the same column to sort in ascending order instead.
Search results can be downloaded at any point, see Can I download data from the database? for more information. All currently visible columns and all rows satisfying search criteria will be downloaded into a comma-separated file.
How do I use the database search function?
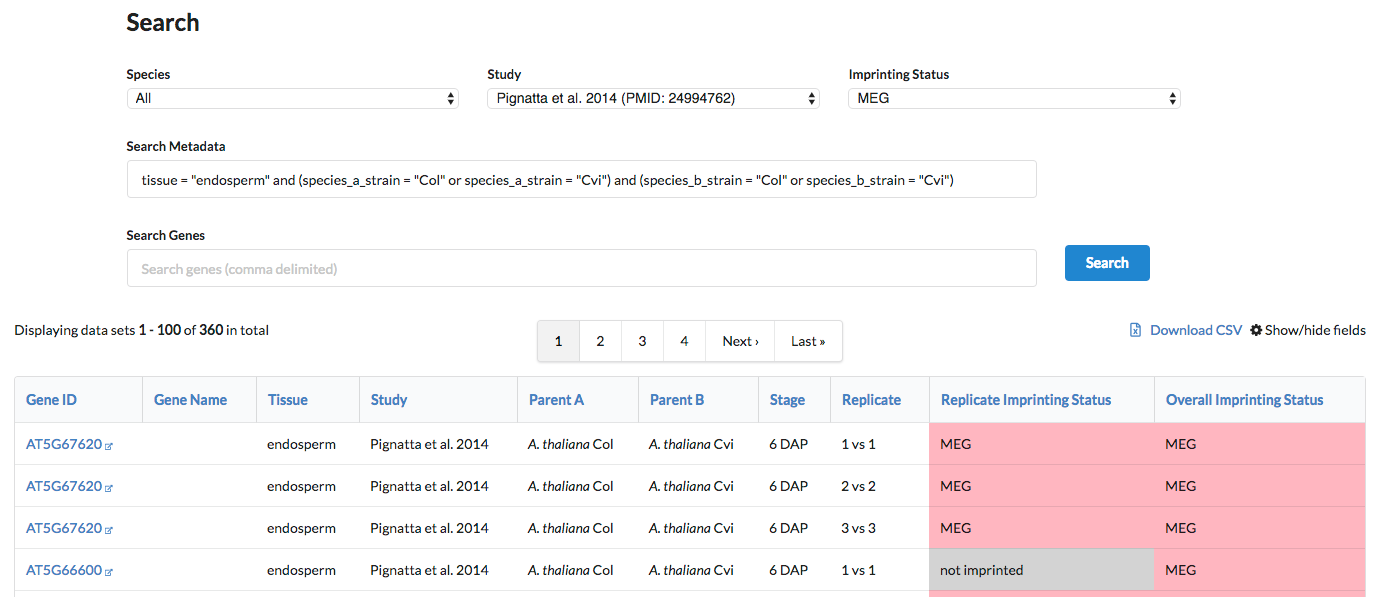
The database includes a powerful set of search tools to help users easily obtain a dataset of interest. Use the three drop-down menus in the Search section to quickly narrow down entries by species, study and/or imprinting status. In addition, the "Search Metadata" and "Search Genes" search bars can be used to perform more complex queries. All these search functions can be used together.
Search by Species, Study, and/or Imprinting Status
Simply select a specific species, study, and/or imprinting status from the corresponding drop-down menu. Only rows with the indicated value will be displayed after search.
Search by metadata
The "Search Metadata" search bar uses Query Language (see examples below; also see https://github.com/wvanbergen/scoped\_search/wiki/query-language) and enables searches in the six "metadata" fields (also see What types of information are stored in the database? ). Parent A and Parent B are composites of species (e.g. A. thaliana) and strain (e.g. Col-0), and these two fields can be searched independently. Therefore, eight different aspects of the metadata can be incorporated into the search, listed below:
| Field Name | Field ID |
|---|---|
| Parent A (species) | species_a |
| Parent A (strain) | species_a_strain |
| Parent B (species) | species_b |
| Parent B (strain) | species_b_strain |
| Replicate | replicate_comparison |
| Tissue | tissue |
| Stage | stage |
| Genome Assembly | genome_assembly |
The field ID (right column) must be used to refer to each field in the metadata search bar (see examples below). The following operators are allowed:
| Operator | Meaning | Example |
|---|---|---|
| = | equal to | strain = "Col" |
| != | NOT equal to | strain != "Col" |
| ~ | contains | strain ~ "Col" |
| !~ | does not contain | strain !~ "Col" |
Different search criteria can be combined using and or or, and using parentheses to indicate order. If no keyword is used, and is assumed.
Example searches:
tissue = "endosperm" stage = "14 DAP" or "6 DAP"
- Outputs all endosperm samples at either 6 DAP or 14 DAP. Equivalent to tissue = "endosperm" and stage = "14 DAP" or "6 DAP".
- Outputs all endosperm samples at either 6 DAP or 14 DAP. Equivalent to tissue = "endosperm" and stage = "14 DAP" or "6 DAP".
tissue = "endosperm" and stage ~ "torpedo" or "6 DAP"
- Outputs all endosperm samples at either 6 DAP or the torpedo stage. This example uses substring matching with '~', so stage will match "torpedo stage", "6 DAP (linear)", etc.
- Outputs all endosperm samples at either 6 DAP or the torpedo stage. This example uses substring matching with '~', so stage will match "torpedo stage", "6 DAP (linear)", etc.
tissue = "endosperm" and stage ~ "torpedo" or "6 DAP" and species_a_strain ~ "Col"
- Same as above, but also requires that Parent A's strain contain the word "Col" - e.g. matches "Col" but also "Col-gl".
- Same as above, but also requires that Parent A's strain contain the word "Col" - e.g. matches "Col" but also "Col-gl".
(species_a = "A. thaliana" and species_a_strain = "Col") or (species_a = "A. lyrata" and species_a_strain ~ "MN")
- Search for all entries where parent A is A. thaliana Col, or parent A is A. lyrata with a strain name containing "MN".
- Search for all entries where parent A is A. thaliana Col, or parent A is A. lyrata with a strain name containing "MN".
Search by gene ID or gene name
The "Search Genes" search bar enables searches for specific genes or lists of genes. Search is based either on the Gene ID or Gene Name fields (see What type of information is stored in the database ) and is not case-sensitive. By default, the search results will display the queried gene alongside all known homologs of the gene in other species in the database (provided the species hasn't already been restricted using the Species drop-down menu). Homology information is retrieved from Phytozome (see Where does the homology information come from and how can I get a copy? ).
Additionally, a list of genes can be provided (separated by commas). For example:
- met1, cmt2, CMT3, AT5G49160, GRMZM2G333916
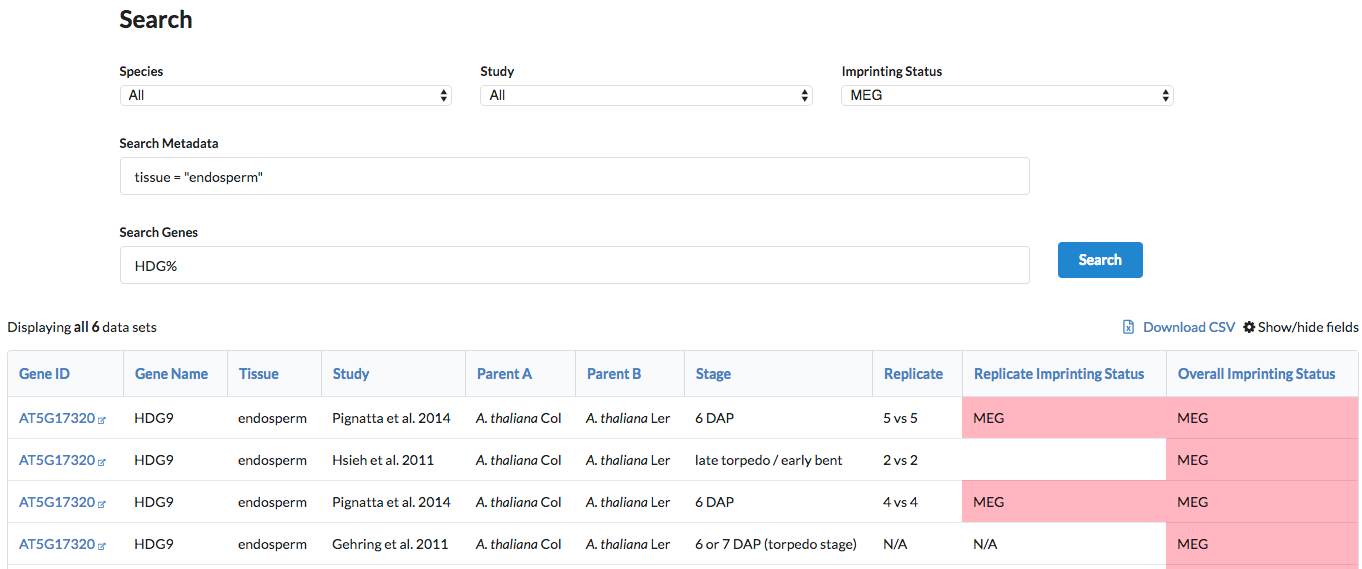
The character '%' acts as a wildcard in the "Search Genes" bar. For example:
HDG%
- outputs all entries where either the gene ID or name starts with HDG (HDG2, HDG3, etc.)
- outputs all entries where either the gene ID or name starts with HDG (HDG2, HDG3, etc.)
Example searches
By combining these different search fields, very specific queries can be constructed. A few examples:
- Get all Col-Cvi endosperm MEGs in Pignatta et al. 2014:
- Get all data for the HDGs that were called MEGs in endosperm, in any species:
Where does the homology information come from and how can I get a copy?
Both the gene names (like MET1) and homologs in other species are obtained by querying thalemine (https://apps.araport.org/thalemine/begin.do), a part of the Arabidopsis Information Portal (Araport). Gene names are obtained directly from thalemine, while homologs are based on data from Phytozome. Note that gene names are only available for A. thaliana genes. See https://www.araport.org/thalemine/user-guide for a guide on using thalemine for these and other queries. The database pulls homolog information for all species currently in the database, and this information can be directly downloaded from the Homology Mapping link at the bottom of the home page. Note that one limitation of the database is that some studies use older annotations which may have incomplete homology information in Phytozome, and thus may not be correctly linked to otherwise known homologs.
Can I download data from the database?
From the search results page, you can download all currently displayed data using the Download CSV link at the top right corner of the table. All rows that meet the current search criteria, as well as all columns currently displayed, will be included in the output file.
I'm interested in performing some imprinting analyses; where to begin?
This database was created as part of a project to create a comprehensive data analysis pipeline for assessing imprinting and comparing imprinting across different species. The publication is available here (link TBD) as a chapter in Plant Epigenetics and Epigenomics, 2nd ed. (part of the Methods In Molecular Biology series). In the paper, we present a simple, easy-to-use analysis pipeline for assessing imprinting from RNA-seq data and/or comparing imprinting across different species. The scripts used in the pipeline are available from Github at https://github.com/clp90/imprinting_analysis, along with detailed installation instructions and a simple example. To report errors or problems with the pipeline, please contact us at plantimprinting@wi.mit.edu.
Who do I contact about adding new datasets, or about errors in the database?
Please email plantimprinting@wi.mit.edu with any questions about the database, or if you know of any other data that could be included.